
GDV Bio-Electrography Before-And-After Results Spotlight A Measurement Path For EESystem™ Research
A new GDV bio-electrography research brief presents “beogram” images captured before and after time in the Energy Enhancement System™ (EES). The before/after visuals suggest a shift toward a more symmetrical field pattern and are positioned as a fast, repeatable way to track changes alongside relaxation-focused sessions—setting the stage for controlled replication.
When a wellness claim becomes research, the first question is always the same: WHAT CAN WE MEASURE—RELIABLY—BEFORE AND AFTER?
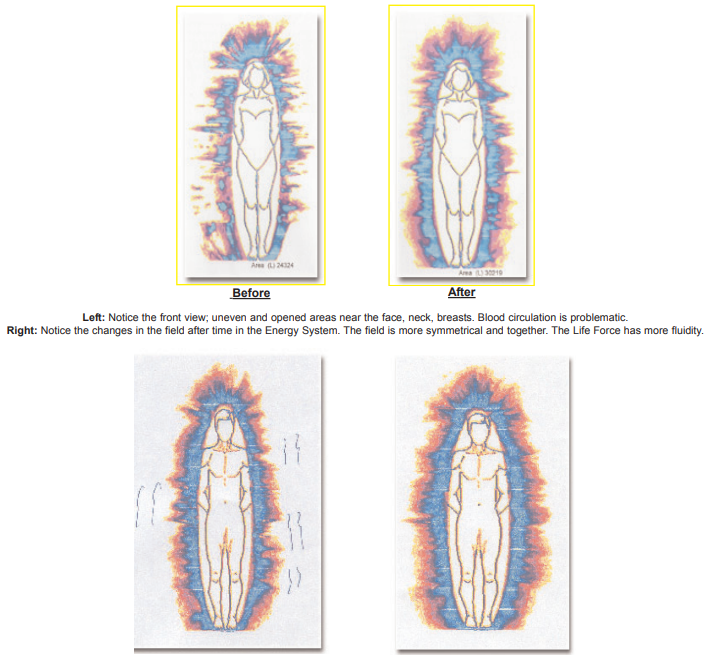
A newly shared GDV bio-electrography brief takes a direct swing at that challenge by presenting “beograms” (biofield-style images) labeled BEFORE and AFTER time in the Energy Enhancement System™ (EES). The goal isn’t storytelling—it’s measurement: capture a baseline, introduce an exposure condition, and document what changes in a way others can repeat.
WHAT THE BEFORE-AND-AFTER BEOGRAMS SHOW
The brief highlights a front-view image set and describes the “before” field as uneven, with opened areas near the face, neck, and chest region, alongside a note suggesting circulation concerns. In the “after” image, the field is described as more symmetrical and consolidated, with “more fluidity” in the overall pattern.
In research terms, this kind of paired comparison is valuable because it creates a clear experimental structure: same subject, same tool, same output format—captured at two time points.
WHY GDV IS A RESEARCH TOOL OF INTEREST
GDV bio-electrography (often discussed alongside Kirlian-style imaging) is used by practitioners because it produces visual outputs quickly and can be repeated session-to-session. The brief frames GDV as a tool used in institutional settings and cites confidence claims about its evaluation capability when applied to human energy-field patterns.
Whether one agrees with the interpretation or not, the research opportunity is obvious: if the output is consistent enough to track, it can be treated like any other observational measurement—tested across time, compared against controls, and analyzed quantitatively.
THE REPORTED EXPERIENCE SIGNALS THE BRIEF LINKS TO EES
The document attributes the before/after shifts to time in the EES environment and connects the observed changes to commonly reported session experiences: calmness, deep relaxation, and a stronger sense of self-awareness. It specifically references GDV researcher Dr. Sabina DeVita in support of these observations.
For investigators, these are hypotheses worth structuring into measurable endpoints—especially when paired with additional metrics such as HRV, sleep data, or EEG coherence.
WHAT REPLICATION-READY RESEARCH WOULD NEED NEXT
For any imaging-based method to carry scientific weight, the protocol has to be tighter than the visuals. A strong follow-up study would typically require:
STANDARDIZED CAPTURE CONDITIONS
Fixed device settings, electrode/contact parameters, timing, and environmental controls (temperature, humidity).
CONTROL AND SHAM COMPARISONS
Matched time and setting, randomized order where possible, and conditions that reduce expectancy effects.
BLINDED REVIEW AND QUANTIFICATION
Independent reviewers scoring images without knowing “before” vs “after,” plus numeric metrics (symmetry indices, area/brightness distribution, coherence-style texture measures).
MULTI-SITE REPLICATION
Same protocol repeated by different operators and locations to confirm the signal isn’t technician- or site-specific.
Categories: Sciences, Educational Technology, Healthcare Technology
Tags: beogram, EES, Energy Enhancement System™, GDV bio-electrography
Additional Links
Just Going Viral
Founded by Hon. Dr. Sandra Rose Michael, DNM, DCSJ, Energy Enhancement System, LLC is a Nevada-based research and technology company dedicated to the responsible exploration of scalar-field and photonic energy phenomena. The company's mission is to p